Engineering 100-950
Lab 2: Temperature Sensing
You should work on this assignment in pairs, but you must SUBMIT YOUR OWN INDIVIDUAL WORK. Aside from hardware photos, all submitted content must be your original work and not copied from anyone else. Submissions that are not your own may result IN POINT DEDUCTION OR A ZERO.
Contents
- Lab 2: Temperature Sensing
Materials
- 1 Arduino Nano Every
- 1 Breadboard
- 1 Programming Cable (and adapters if necessary)
- 1 TMP36 Temperature Sensor
- 1 BME680 Sensor
- A hand-full of jumper wires
- A computer with the Arduino IDE installed and setup.
- KiCAD installed
- BME680 and TMP36 KiCAD Symbols
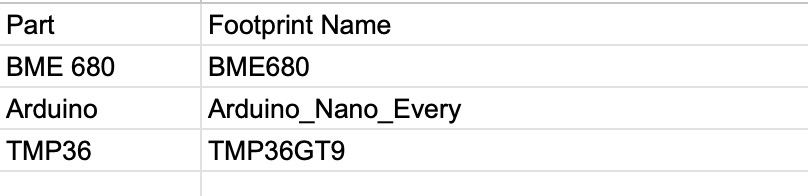
- List of symbols to use for Schematic
Introduction
This lab represents the start of your journey into the development of your payload’s sensor board. Your board will measure an ensemble of variables, including temperature, pressure (to derive altitude), and acceleration vector. We will begin with the simplest, most visceral metric: temperature. This lab will introduce you to the sensors associated with your sensor board, the digital sensor (BME680) and a analog temperature sensor that you will need to calibrate (TMP36).
A sensor is a device that provides measurement of some environmental observable. Many times, sensors work by transduction whereby they convert one form of energy into another, often times converting input to electrical energy. However, how do we know what the relationship is between the input and the output? If, for instance, the output from a temperature sensor reads as 2 Volts at room temperature, what does an output of 3 Volts mean? In order to answer this question, we need to generate a calibration curve for the sensor: an equation that maps input values against output values.
Here’s a cool example: since you’ll be dealing with a temperature sensor this lab, check out these calibration curves for different flavors of a temperature sensor that relies on a physical process called the thermoelectric effect. When two dissimilar metals are brought into contact, a voltage is generated between them that is proportional to temperature. Hence: Thermo-Electric. This sensor is called a thermocouple. In the figure below, we can see multiple calibration curves for different types of thermocouples.
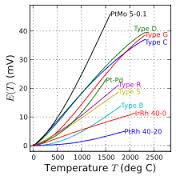
Over the next few weeks, you will become very familiar with the sensors used in this course. We’ll start by looking at the BME680 and the TMP36 sensor we’ll be using for the semester. Unlike the thermocouple, the TMP36 sensor has a lot of processing circuitry built into it to make its calibration curve linear. More on the BME680 later.
How Analog to Digital Converters (ADCs) Work
In lab 1, you may have figured out the form of the relationship between the raw voltage and value returned by analogRead(). However, it’s unlikely you got this relationship exactly right, as that requires a slightly deeper understanding of how they work at the physical level. We wanted you to simply begin to think about how it worked before. Now, we’ll cover this subject more deeply than both the prior labs and videos did.
To begin, we have to consider the differences between the real world and the digital world. The digital world is essentially discrete, whereas the real world is essentially continuous (we are going to ignore quantum mechanics). This means that when converting from the real world to the digital world, there will be some loss of information. This is an important fact to consider when evaluating a sensor or other tool.
The ADC we’re using in class is no exception - the maximum resolution, or how finely the instrument can be read, is controlled by the number of bits in the ADC. The more bits an ADC has, the higher the resolution. The equation below lets you calculate an approximate resolution. \(V_{ref}\) is the maximum voltage of the ADC and bits is the number of bits in the ADC.
\[Resolution = \frac{V_{ref}}{(2^{bits}-1)}\]Now, to turn the raw value returned by analogRead() into a voltage, you need to simply multiply it by the resolution of the ADC. This is shown by the formula below.
This is not exactly correct, but we will cover this in class later.
BME680 4-in-1 Digital Sensor
The BME680 is a digital sensor that measures temperature, humidity, pressure, and VOC gases. VOC stands for Volitile Organic Compound, think organic solvents like alcohols and paint stripper. The pressure data from this sensor can be used to calculate your altitude since atmospheric pressure decreases with altitude.
This is a digital sensor, which means that instead of connecting it to an analog pin on your Arduino and reading the raw voltage, it will connect to a digital pin. This also means that you will not need to calibrate this sensor, since you will be reading a direct measurement from it and not voltage.
Procedure
1. Wiring the BME680
In the real world of electrical and computer engineering, there most likely won’t always be a tutorial to hold your hand and tell you how to wire up a component. As such, instead of showing you exactly how to wire up your BME680, here are the sensor’s technical specs, which include wiring information on page 12.
Note: Make sure to also look at the section labeled Install Adafruit_BME680 library in the spec sheet.
2. Creating the BME680 code
Since the BME680 can be somewhat complicated to interface with, an example has been provided in the Arduino library for this class. Take a few minutes to look through the example and understand each part. Note that this example only covers basic communication with the BME680, so you will need to use this program as an example of what to add to your code later on. Go to File → Examples → ENGR100-950 → BME680_Example_code.
If the BME680_Example_Code script does not show up, your library may be out of date. To update it, first try restarting the Arduino IDE. If this doesn’t work, try following the same steps you took to install the library to update it.
For now, you can upload the code onto your Arduino and look at the values that the BME680 is outputting through the Serial monitor. The data from the BME680 will be in the physical units of the corresponding type of measurement (e.g. C for temperature), and not voltage or raw value like your analog data. Check what unit each sensor reads by going through the spec sheet.
Later, you will use the BME680 to calibrate your TMP36, so for now, make sure that the output values are reasonable. A value of 15,000,000 for temperature is not reasonable, unless you are in the core of the Sun.
To check if the temperature sensor on the BME680 is working, we want to warm up or cool down the temperature sensor. You can do this by simply putting your fingers over the sensor for a minute and watching the temperature change in your Serial monitor. If the temperature does not change, you may have something wrong in your circuit.
3. Wiring the TMP36
Make sure to wire the TMP36 close to the BME680 to ensure that they are both able to read close to the same environmental temperature.
This video goes through how to set up the TMP36 and is very useful to watch before you get started.
Using the image below, take note of which pins must be connected to each circuit element. Connecting the TMP36 backwards will quickly smell like BBQ… Please watch the youtube video above to get the orientation right before burning your fingers.

This sensor is rather simple to interface with. When the temperature changes, the output voltage of the sensor changes as well.
4. Uploading the Code
Once your TMP36 is plugged in to your Arduino Nano, go to File → Examples → ENGR100-950 → Lab2-Temp_Sensing.
If Lab 2’s example script does not show up, your library may be out of date. To update it, first try restarting the Arduino IDE. If this doesn’t work, try following the same steps you took to install the library to update it.
You will need to modify the analog pin number you are reading off of for this lab. Unlike the last lab, where we provided a specific #define compiler variable for you to change the pin with at the top of the example script, this time, you will be changing the value yourself.
In the provided start code, locate the loop() function and find where analogRead() is called. It is set to default to pin A1, but you should change this to be whatever analog pin you plugged your TMP36 into.
You should also add any BME680 code that is needed for the BME680 to work in your Lab 2 program. Most, if not all, of the code needed for the BME680 is outlined in the Lab 2 program. For example, for the comment // Include necessary libraries for BME below: you would add the libraries below the comment like so.
...
// Include necessary libraries for BME below:
#include <Wire.h>
#include <SPI.h>
#include <Adafruit_Sensor.h>
#include "Adafruit_BME680.h"

// Instantiate BME here:
...
Make sure to refer back to the BME680_Example_Code and ensure you have a general idea as to what each line of code is doing. If you do not understand something, ask an IA! It is important that you understand what the BME680 code is doing as you will be using this sensor throughout the entire class!
Before we move on to collecting data, let’s make sure the circuit is working as expected. Again, we want to warm up or cool down the TMP36. You can do this by simply putting your fingers over the sensor for a minute and watching the voltage change in your Serial monitor. If the voltage does not change, you may have something wrong in your circuit.
5. Collecting Data
Now we have a circuit and some code to tell us what the raw voltage our TMP36 is reading in, as explained above in How Analog to Digital Converters (ADCs) Work.
In order to turn this voltage into a useful temperature, we need to do some math with a calibration curve. This is where the spreadsheet you made during Tuesday’s lecture (which you definitely attended, right?), comes in handy.
To build this two-point calibration curve, we need, as the name suggests, two points. For this lab, we will collect one temperature inside, and one outside.
For this lab, use the temperature reported by the BME680 as the reference (ground truth) when recording and comparing measurements.
- Start by making a copy of the calibration curve spreadsheet you made during lecture. For those of you who did not attend lecture, see the lecture slides on Canvas, watch the lecture recording, or Google/ask a friend about how to make a calibration curve. It is quite simply a way to find the slope and offset of a linear equation to connect two points. This slope and offset is what we will use to convert our voltage into a temperature.
-
In your calibration curve copy, set aside a space to make raw measurements before entering things into the spreadsheet. This could be a simple table on a new sheet, or just a table off to the side. It should look something like this:
Voltage Temperature (°C) Indoor Test Outdoor Test -
Now, let your circuit sit still on your workbench for a minute to let it adjust to the temperature in the lab. Record (using Serial monitor), what the rough average voltage reading is while it is stationary inside. Additionally, make a note of the temperature of the room by looking at what the BME680 is reporting.
- Next, pick up your whole circuit and computer, and take a field trip outside. Find a nice spot in the sun (or out of the rain if the weather doesn’t cooperate) and again let your board sit for a while. While you wait, you should be able to watch the voltage readings in your Serial monitor slowly level out. Once there is no longer much change between their values, take their rough average current value and record it into the table in your spreadsheet. Record this along with the current outside temperature reported by the BME680. (You could also find a refrigerator or freezer around the building and put your board in one of these.)
6. Making a Calibration Curve
Now that you have filled out your basic table of indoor and outdoor (or refridge) temperature and voltages, plug these values into your spreadsheet to calculate your calibration curve.
Your calibration curve for a TMP36 will be linear, unlike a curve for a thermocouple as described in the introduction. This means your final calibrated equation will take the form of \(y=mx+b\), where \(m\) is the slope and \(b\) is the y-intercept.
The \(m\) and \(b\) values calculated from this step are what you will use in the next step.
7. Modifying the Code
Now we are ready to change the Arduino’s code so that instead of printing a voltage, it will print a temperature.
To do this, there are some commented out lines that define slope, intercept, and tempC. You now need to uncomment those lines (by removing the leading slashes), and update their values to whatever values you got in the previous procedure step.
Finally, we need to tell the Arduino to print out the tempC variable instead of the voltage variable to the Serial monitor, so we do this by changing what variable is added into the dataString from dataString += String(voltage); to dataString += String(tempC);.
Run your code again and look at the Serial monitor. You should now see values that look like temperatures. The TMP36 and BME680 should roughly match in temperature. If they do, move on to the next step.
8. Field Trip Pt. 2
We are now finally ready to record our temperatures as we go outside. Start by opening the Serial plotter:
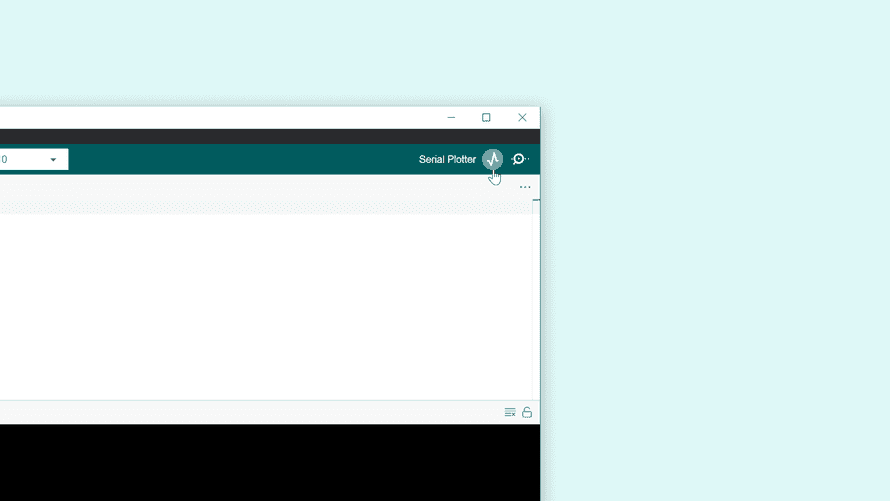
You should now see temperature data being graphed in real time!
While you have the Serial plotter open, walk outside and wait for your temperature to adjust and flatten out on your plot. Once this is done, take a screenshot of the plot.
This will be one of the things you include in your submission.
Post-Lab Questions
To get you thinking critically about how your 2-point calibration curve works, as well as more comfortable with using a spreadsheet, answer the following questions:
- If your Arduino read in a voltage of 0.4V, what temperature would that equate to on your calibration curve? (Show your work!)
- What would the voltage (based on your own calibration curve) be if it output a temperature of 6 °C? (Show work!)
- What binary value would your Arduino be reading in for a voltage of 0V? 2.5V? 5V? If you are stuck on this, try re-reading the section about how analog to digital converters (ADCs) work and try working backwards through the Arduino code. The
analogRead()function is what actually returns the binary value, so if you know the voltage, could you re-arrange the equation given in the starter code to solve for the binary value?
Schematic Tips
For the schematic of your circuit, there are a couple of things that you would have to pay attention. This time, you will be graded based on using the correct symbols, or rather the correct components. Last lab, (lab 1b), you used generic resistors, batteries, and components, for this lab, please refer to the List of Symbols provided earlier.
KiCAD keeps a lot of compoenets and their footprints inside of it’s internal libary, but for the BME 680 sensor, and the TMP36, you would have to import them. The instructions for importing symbols can be found here
Memo
In addition to the pdf you will create as detailed in the submission below, you will also be writing a memo for this lab.
For details about the memo see Canvas.
Submission
Reminder: You should work on this assignment in pairs, but you must SUBMIT YOUR OWN INDIVIDUAL WORK. Aside from hardware photos, all submitted content must be your original work and not copied from anyone else. Submissions that are not your own may result IN POINT DEDUCTION OR A ZERO.
On Canvas, you will submit ONE PDF that will include all of the following:
- A screenshot of your calibration curve spreadsheet.
- Your data table of indoor and outdoor temperatures and voltages.
- A screenshot of your Arduino IDE’s Serial Plotter output showing the temperature as it changes as you walk outside.
- Answers (and any work you may have) to the post-lab questions.
- A screenshot of the schematic of your temperature sensing circuit (made in KiCad).
To put said content into a PDF, it is suggested you create a new Google Doc and paste your images and write your text in the document. Export/Download this document as a PDF and upload it. DO NOT SUBMIT A GOOGLE DOC FILE OR SPREADSHEET FILES.
Seperately:
- Also upload your memo as a PDF to the Memo 1: Temperature Sensing assignment on Canvas. This memo is a completely separate submission from the PDF you turn in for this lab.