Engineering 100-950
Lab 5: GPS and an Integrated System
Contents
Materials
- 1 Arduino Nano
- 1 Breadboard
- 1 GPS Module & Antenna
- 1 Level-Shifter
- Completed Circuit from Lab 3 and 4
- Programming Cable (and adapters if necessary)
- Computer with the Arduino IDE installed and setup
- ENGR100-950 libary
- 1.3.5 Arduino Library Scripts (if 1.3.5 isn’t currently showing in Arduino IDE) Examples
Introduction
Up until this point, you have been dealing with analog sensors - their only output is a continuous DC voltage that is related to the physical phenomena they measure. However, analog sensors are only a small subset of sensors that exist! In fact, this single output format is rather limiting - we can only express information about one specific parameter of interest. In previous labs, we used the Arduino to write lots of different types of information to the Serial monitor and the SD card. That information was encoded as digital signals. Thus, we’ve transmitted digital signals in the past, but until today we haven’t needed to receive and interpret them. In this lab, we’ll use our first digital devices: the GPS module and the data logger. This GPS module communicates through the simple UART communications protocol. We’ll need the SoftwareSerial library, which will allow us to communicate with the GPS. In addition, the data logger communicates via a Serial Peripheral Interface (SPI). This is similar to the serial port, but slightly different. Luckily, the Arduino is set up to do this communication and header files allow us to use this functionality!
The GPS doesn’t really ’measure’ any sort of physical quantity. Instead, it receives messages from satellites which are used to generate GPS information packets. These packets are continuously output by the GPS module, even when it doesn’t have a proper GPS fix. This sort of continuous output is called spewing. Having a GPS fix means the GPS is reasonably sure about your location on Earth, with only a few meters total of potential error. The output of the GPS are formatted as NMEA strings. NMEA strings are simply a predictable way to format the location, altitude, and diagnostic stamps that the GPS provides into messages. These strings are identified by a 5 letter identifier. Here’s a list of all of them:
We are only (mostly) interested in GPGGA strings and a particular PMTK string, e.g. the lines of output preceded by $GPGGA and $PMTK. This 5 NMEA string organization will become clear as you view the raw output.
IMPORTANT: We recommend saving intermediate Arduino codes, so that if something isn’t working, you can always go back to the last thing that worked. This is a good practice to start to get into, since in your engineering career, you will be doing a lot of complex things that build on what you have done before.
IMPORTANT: When we are dealing with serial communication and loading the Arduino with a lot of memory, which we are doing today, our Arduinos can sometimes ”freakout”, and become stuck. The way that we often solve this problem is to unplug the Arduino, and load the ”blink.ino” program into the Arduino IDE. We then plug in the Arduino and quickly try to load the blink code (make sure the right port is selected, since when you unplug and plug in the Arduino, your computer can change the port). This often stops the Arduino from misbehaving, and we can try to upload the other code.
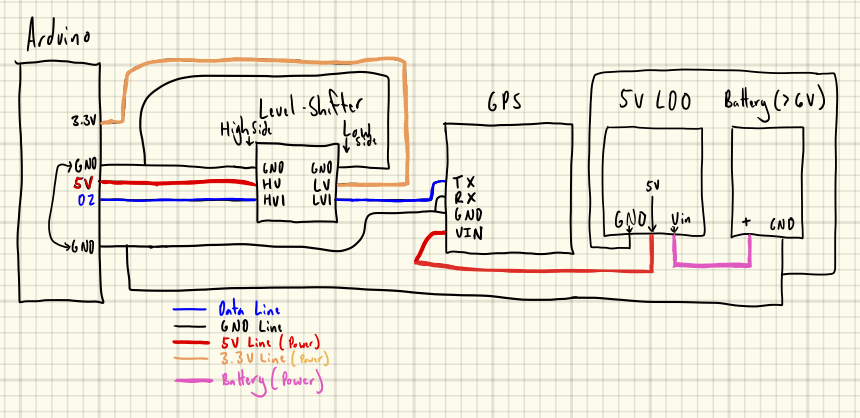
Schematic for the connections between the Arduino and GPS shown above.
Level Shifter
The GPS operates on a 3.3V logic and sends the digital signals with a maximum voltage of 3.3V on its communication lines. Our Arduino, however, reads digital signals of either 0V or 5V. This means that we may not be able to read the 3.3V signals from the GPS, and thus we can’t communicate with it directly. We will use a logic Level-Shifter to convert from 3.3V to 5.0V. This Level-Shifter will take the digital 3.3V logic of the GPS and convert it into 5.0V logic of the Arduino (it can also do the reverse as well). The Level-Shifter is shown below. It is actually a generic device in that it can shift between two different arbitrary voltages. For our application, these voltages are 5.0V and 3.3V. In order to do this, we have to provide the Level-Shifter these voltages, therefore, it requires references to (read: electrical connections to) the two voltages that you’re trying to convert between – in our case, 5V on the high voltage (HV) pin, and 3.3V on the low voltage (LV) pin. Since there are two references, there are two grounds, one on either side of this device, that both need to be connected to ground.
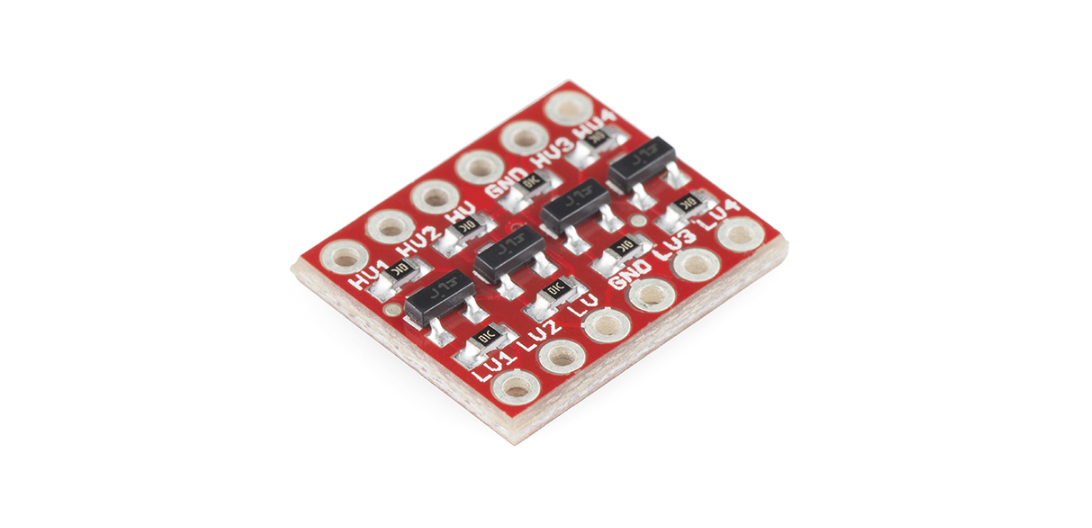
The level-shifter component you will be using today is shown above.
Apart from the voltage references, there are the high and low voltage channels. The Arduino reads logic on a scale of 0-5V and the GPS sends information on a scale from 0- 3.3V.
Keep in mind which side of the Level-Shifter is the low side and which is the high side when connecting components – reversing them could be bad.
Wiring and Testing GPS
TX (Transmit): The pin that outputs digital data (like 1s and 0s) from a device.
RX (Receive): The pin that accepts incoming digital data into a device.
-
Connect the GPS to your Arduino, as described in the schematic above. You only need to connect to the GPS’s VIN (3.3V or 5V), GND, TX and RX pins. The GPS TX and RX need to go through the Level-Shifter, transferring from 3.3V TX on the GPS side to 5.0V RX on the Arduino side. Designate a port (D2 and D3) to take in data from the TX and RX pins from the GPS.
Remember that the TX pin on the GPS go to the RX pin (D2) on the Arduino and that the RX pin on the GPS go to the TX pin (D3) on the arduino.
We are going to need to send a message to the GPS because we want the GPS to enter BALLOON MODE. This is important because if we don’t, after a certain altitude, the GPS will just shut off. See the below image to see the packet type that we will be sending to the GPS.
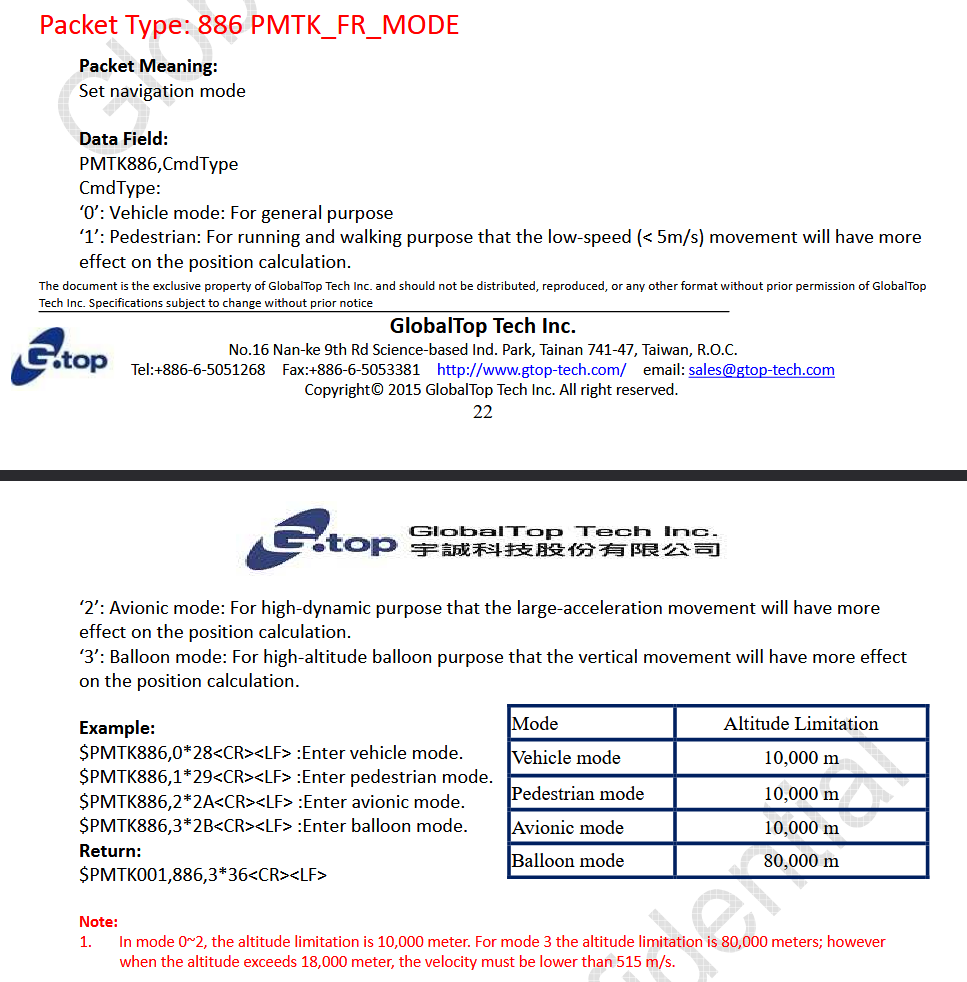
Note the return string
$PMTK001,886,3*36. This is important because we expect to received this if the GPS was successfully put in balloon mode. -
Test your wiring by creating a new Arduino sketch. We have supplied a sample code called
read_gps_single_character.ino. This code reads from your new Software-Serial port (D2 and D3) using the.read()function. If you aren’t familiar with the.read()function in the SoftwareSerial library, there’s a good reference for it here.-
Once it reads the character, it outputs each character to the Serial Monitor. If the
.available()function returns a 0, that means that no new characters are in the buffer to read, so you shouldn’t read them or output anything. The baud rate should be 9600 on all ports. Your output might look garbled, like a series of commas with nothing in between them, but that’s simply because your GPS can’t collect data indoors. We call this condition ”not fixed.” -
We send the balloon mode packet
$PMTK001,886,3*36to the arduino by simply printing it to the GPS. Then, thewaitForConfirmation886()function checks to see if the GPS received. If the GPS has successfully received it and executed the command, you should see the return string$PMTK001,886,3followed by✅ Balloon mode command received.
Make sure to take a screenshot of both confirmation strings,
$PMTK001,886,3and✅ Balloon mode command received, as you will be submitting this.If the Serial Monitor is scrolling too quickly to capture a screenshot and you can’t scroll up because it keeps jumping back to the newest output, turn off Autoscroll. Click the two downward arrows in the top-right corner of the Serial Monitor pane (not the top-right of the entire Arduino IDE window). With Autoscroll disabled, you can scroll up to find both confirmation strings and then take your screenshot.
If the GPS doesn’t respond within 3000 ms, the sketch will print:
⚠️ No ACK seen (check wiring/baud/command format/bad timing). In that case, try resetting the Arduino to resend the command. This usually works because the GPS may have been busy (or the serial link was momentarily noisy) when the command was sent, causing the module to miss or ignore it.- Take your board outside and see if you can get a GPS fix. This may take up to 10 minutes of waiting outside. Make sure you have the antenna facing upwards with a clear view. Try to stand far away from any buildings with a clear path to the southern sky to avoid multipath errors. Once you have a fix, your GPS module’s red light will start flashing in a different frequency and you should see more dense output on your Serial monitor. Once you get a fix, write down the latitude and longitude and come back inside. Put this latitude and longtitude into a map tool, and verify that it is pinging you at the CSRB before continuing.
Take a screenshot of this google maps or other tool verifying you are at the CSRB for your post-lab submission
This is a picture of the upward facing side of the antenna
-
-
The problem with the above code is that it is 100% dedicated to the GPS. What we need to do is have the code so that it reads in the GPS data, stores it, and then outputs it. Then we can blend this code with the other sensor data, allowing us to read both the GPS and sensor data and outputting it all. This is a bit complicated, though. Open up the
read_gps string.inoexample which reads in the gps data into a c-character array (with a length of say 500 characters -char gpsString[500];), and then displays this array to the serial port using the print function. How to make this work:-
The buffer between the gps and the Arduino is only 64 bytes long, while the gps string is often much longer than 64 bytes. What that means is that the buffer fills up, then gets overwritten, then empties out. So, if you start reading from the buffer at a random time, it may be halfway through the gps buffer. We don’t want that.
-
The
available()method for the port will allow you to check to see if there is any data in the buffer. If you named your gps port “gps”, then you would callgps.available(). - A way to make sure you catch the gps when stuff is just being written to the buffer is doing a multi-stage check: (1) do a
while gps.available()dogps.read()to clear the buffer and just ignore this data; (2) do awhile !gps.available()dodelay(1)to just wait until the buffer starts to get data again; (3) note the time usingmillis(print to the serial port); (4) do anotherwhile gps.available()loop where you read in the data into your c-character array, like:i = 0; while (gps.available()){ mystring[i] = gps.read(); i++; } -
For ease, the steps above are in a function, so you can call that and it reads in the gps data.
-
For ease, the c-character array is a global variable.
-
For ease, a function sets all of the characters of your c-character array to null characters
\0. - Your
loop()function should have only three lines that: (1) calls a function to initialize the c-character array; (2) read the gps data; (3) display the gps data to the serial port.
-
Once that works, you are mostly there!
Set a delay in your code for something like 5 seconds, so not too much data is output.
Go back outside with your board again and collect some gps data. Walk around the perimeter of the CSRB and the parking lot, recording the GPS data in your serial monitor. When you are done, copy and paste your data into a log file. Save the code and the data, and submit it with your PostLab.
Write a matlab (or python or whatever) code that will read your GPS data. Grab the lines that start with $GPGGA. Parse these lines so that you can get the time, latitude, and longitude. (If it is too difficult to figure out how to do this you can do this later…), simply copy and paste the $GPGGA lines into a new file so that all of the lines in the file have $GPGGA lines. You should then be able to read this into Matlab (or python) with a CSV reader. Then, you can use a variety of different matlab functions to plot those coordinates on a map.
This plot is also needed for your post-lab submission.
Note: latitude and longitude are not exactly the right units. Technically, they are given as DDMM.MMMMM (for latitude) and DDDMM.MMMMM (for longitude), where D is degrees and M is minutes. See question 4 below.
Using Matlab (or python), make a plot of latitude vs time, longitude vs time, and latitude vs longitude (3 plots total).
Take some of the latitude and longitude output from the GPS (at least 4 points) and manually put it into a google maps file as either lines or pins. Show these points on the google map and take a screenshot of this.
Submit these with your postlab.
Complete Circuit
Now that you have tested the GPS isolated from everything else, it’s time to combine everything and make sure it works! Open up the SensorIntegrationGPS.ino example code, update all of the variables, and see your complete circuit work!
Go outside and get a lock for your GPS. Once your GPS has a lock, wait for around a minute to let data print onto the SD card. Afterwards check that the SD card has both GPS and sensor data and if it does, congrats, you are done!
Take a screenshot of both GPS and sensor data from your preferred spreadsheet software (not you serial monitor). You will submit this!
Post Lab Questions
-
What does the .available() function do?
-
What is the SPI interface and why is it useful in 1-2 sentences?
-
The Arduino has something known as a serial buffer. This buffer stores the bytes sent from the GPS (or whatever module you’re connected with) to the Arduino. It works like a circular buffer. Look up what a circular buffer is (Wikipedia is a great source here), and give a brief definition below (1-2 sentences).
-
The GPS part hints that the latitude and/or longitude may not be in exactly degrees when divided by 100. Why might this not be the case (hint: think about how navigators sometime discuss locations in terms of degrees, minutes, and seconds)? How could you take the format as is (DDMM.MMMMM) and convert it to decimal degrees, which is what is needed.
Point Breakdown & Summary
This lab will be worth 20 points total in your grade and is graded as follows:
-
Lab 5 Postlab: 17 points (Engineering, Team)
-
Lab 5 Figures: 3 points (Technical Communication)
Submission
On Canvas, you will submit ONE PDF that will include all of the following:
- All (or if you took a lot, then a subset of) GPS data (copy and paste into the PDF)
- A plot of your path as you walked around the CSRB building (this is your latitude vs longtitude plot)
- Plot of latitude vs time and longitude vs time
- Google Maps screenshot of the GPS location information
- Answers to the post lab questions (as part of the .pdf file)
- A screenshot of both the
$PMTK001,886,3and✅ Balloon mode command received - A screenshot of your GPS and sensor data from your preferred spreadsheet software
- A screenshot of your kiCAD schematic (entire circuit from lab 3/4 + GPS and level shifter). Make sure to swap out your Arduino and BME for the updated symbol from our symbols libary if you haven’t already.
TECH COMM NOTES:
- Print your MATLAB or Python figures to png or pdf, do not use screencaps/screenshots.
- Include all necessary titles and axis labels.
To put said content into a PDF, it is suggested you create a new Google Doc (docs.new) and paste your contents and write any text in the document. Export/Download this document as a PDF and upload it. DO NOT SUBMIT A GOOGLE DOC FILE OR SPREADSHEET FILES.
Submitting anything other than a single PDF may result in your work not being graded or your scores being heavily delayed.